
Is ‘Rolling Returns’ Better Indicator of Consistency in Fund Performance?
#
23rd Jun, 2021
- 3649 Views
NDNC disclaimer: By submitting your contact details or responding to Bajaj Allianz Life Insurance Company Limited., with an SMS or Missed Call, you authorise Bajaj Allianz Life Insurance Company Limited and/or its authorized Service Providers to verify the above information and/or contact you to assist you with the purchase and/or servicing
An edited version of this article has been published on Outlook Money at this link – https://www.outlookindia.com/outlookmoney/mutual-funds/is-rolling-returns-better-indicator-of-consistency-in-fund-performance-7733
Most investors tend to only look at the point-to-point (P2P) trailing returns of a ULIP fund or mutual fund, and some tend to incorrectly focus more on which have been the top performing funds over the past year especially—while choosing their fund investment. The problem with P2P returns is that they tend to get distorted sometimes due to significant outperformance / underperformance in 1 or 2 years. Therefore, there may be a time period bias due to that. To take an example – imagine Fund X, which is a large-cap fund, and has delivered a huge return of 100% in year 2009—when there was a strong market rally. As a result, its trailing returns over 2 years and 3 years will also start looking good, due to spill-over. Hence, we may be influenced to choose the fund. But the important question is whether Fund X has been a consistent outperformer in past years and continues to perform well in following years too.
Performance ranking of funds sees dispersion from year-to-year; focus more on consistency in performance
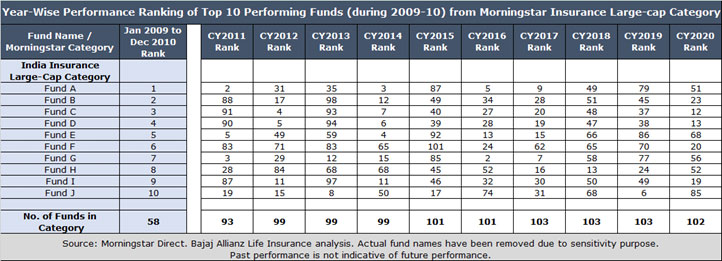
Given above is an illustration of the top 10 performing funds from the Morningstar India Insurance Large-cap category during the strong market rally seen in calendar year (CY) 2009-2010, and what has been their performance in following years. We have renamed the funds as Fund A, Fund B and so on (and removed the original names), for sensitivity purposes. For example: We can see that the 2nd, 3rd and 4th best performing large-cap Ulip funds during 2009-10, underperformed significantly in CY2011—coming in at rank number 88, 91 and 90 respectively (out of 93 funds in the peer category). Also, the performance ranking of the funds varied widely in the following years, and in several years–many of the top 10 performing funds (of 2009-10) failed to re-appear consistently among the top 10 ranks again, or for that matter even in the top quartile (top 25% of funds in peer category). This highlights the fallacy of looking only at point-to-point performance, and especially the yearly top performing funds, while investing. So, then what should we look at to measure consistency in performance of a fund? One parameter to look at is the rolling returns of the fund
What are Rolling Returns, and how do you evaluate them? Rolling returns helps to remove the point-to-point bias in performance and display the returns in overlapping cycles, thereby helping to evaluate consistency in performance. For example: if we take 5-year rolling returns, with monthly shift, over a 10-year period, then it will show how the fund has done in various 5-year periods, by shifting a month each time, over a 10-year tenure. So rather than looking at one discrete period of 5 years, we look at several 5-year rolling periods (in this case, 61 five-year rolling period observations), and how the fund has performed in each of them. You can analyse in how many percentage times of the rolling period observations, the fund has beaten the benchmark index as well as the peer category. You can go one step further and analyze that within the rolling period observations how much percentage of observations feature in each of the four quartiles (within the respective peer category).
For example, if 80-90% or above of a fund’s rolling period observations have featured in the top two quartiles or has beaten the benchmark index & peer category, then it indicates strong consistency in performance over the fund over the long term. So, therefore, along with trailing returns (like 1 year, 3 years, 5 years, 10 years etc.) of the fund, one should also look at the rolling returns, to get a true and better picture of performance consistency.
There is good correlation between rolling returns, trailing returns & star ratings of fund
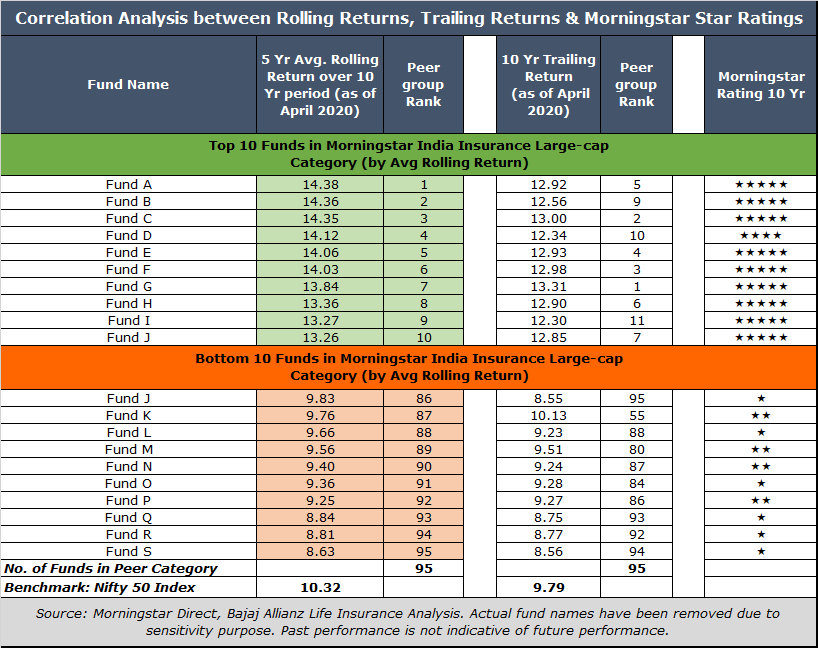
The above illustration shows that there is a good correlation between rolling returns, trailing returns & star ratings of funds over the long term. Average rolling return is the average return of all rolling period observations for the specified tenure. The top 10 large-cap ULIP funds by average rolling return (over 10 years) are also amongst the top 10 performing funds in terms of trailing (P2P) returns over 10 years, and most of them are Morningstar 5-star rated funds over 10 years too (indicating they have delivered superior risk-adjusted returns over the long term). On the flipside, the bottom 10 large-cap ULIP funds by average rolling return (over 10 years) are also amongst the bottom performing funds in terms of trailing (P2P) returns over 10 years, and most of them are Morningstar 1/2-star rated funds over 10 years (indicating poor risk-adjusted performance).
Therefore, investors may look at rolling returns as a preferable performance metric to choose funds with a consistent and long-term performance track record. After all, investing is a long-term journey, which can be quite rewarding for the patient ones; and more so for long term investment products like ULIPs.
Disclaimer: “The views expressed by the Author in this article/note is not to be construed as investment advice and readers are suggested to seek independent financial advice before making any investment decisions”

Enter your email address to subscribe to this blog and receive notifications of new posts by email.

Facebook
Twitter
pintrest
instagram
Whatsapp
Linkedin
More