
Five charts that provide some comfort amidst market volatility
#
12th Mar, 2020
- 7323 Views
NDNC disclaimer: By submitting your contact details or responding to Bajaj Allianz Life Insurance Company Limited., with an SMS or Missed Call, you authorise Bajaj Allianz Life Insurance Company Limited and/or its authorized Service Providers to verify the above information and/or contact you to assist you with the purchase and/or servicing
1. Equities have become relatively more attractive as indicated by bond yield (minus) equity earnings yield valuation indicator
India Bond Yield Minus Equity Earnings Yield Vs Market Return Trend
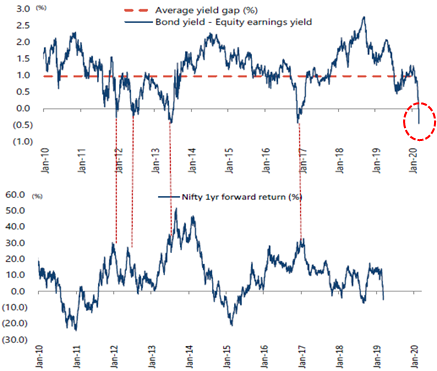
Source: Bloomberg, Jefferies. Past performance is not an indicator of future returns.
• Equity earnings yield is inverse of the Nifty P/E ratio—and indicates what equities is yielding as an asset class. Typically, when bond yield (minus) equity earnings yield gap reduces or turns negative, then equities start to look more attractive (than bonds) from a relative valuation perspective.
• It can be seen in the chart above that when the gap has become negative in the past (like in year 2012 beginning, year 2013 or year 2017 beginning) then it has offered buying opportunities in equities—as indicated by the Nifty 1 year forward return.
• Presently, with the market correction the gap has turned negative (as highlighted in the above chart) and is the biggest gap we have seen since the global financial crisis in 2008-09. This indicates that equities have started to look more attractive on a relative basis.
2. Nifty index Forward P/E ratio has dropped to near 15X multiple, indicating that market valuations are quite reasonable now
Nifty 1 Year Forward P/E Ratio Trend
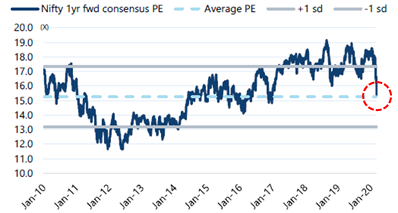
Source: Bloomberg, Jefferies
3. Sharp fall in oil prices is beneficial for a net oil importer like India
Brent Crude Price Trend ($ / barrel)
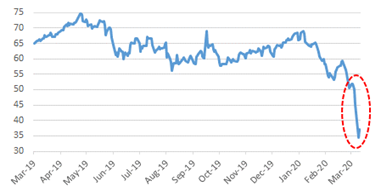
Source: Bloomberg
• Crude oil prices were weak due to Coronavirus concerns, and the recent price-war between Saudi Arabia & Russia has further aggravated the crude price fall
• This is beneficial for a net oil importing country like India, where crude oil accounts for a large part of our imports.
• India imports ~1.3 billion barrels of crude every year, so a $20/barrel fall in crude price will result in an annual savings of ~$26 billion. This will in turn help to reduce our current account deficit. Market estimates indicate that a $10/barrel fall in crude price helps to reduce current account deficit by around 40 bps (0.4%).
4. Bond yields and interest rates have fallen sharply, helping to bring down cost of capital for companies
• The 10 year benchmark bond yield has fallen by more than 120 bps (1.2%) over the past year, and RBI has cut interest rates (repo rate) by a cumulative 135 bps (1.35%). RBI has also taken various steps to increase monetary transmission of interest rates & improve liquidity in the system.
• This fall in bond yields & interest rates will help to reduce cost of capital (cost of borrowing) for companies, and therefore is beneficial for them.
• The US Fed recently cut interest rates by 50 bps, and other global central banks have started to engage in monetary easing—responding to the Coronavirus concerns on economic growth. The RBI has also said that it is ready to take action to maintain financial stability. This opens up space for further monetary easing in India, if the coronavirus epidemic or market volatility escalates.
India 10 Year Yield Vs Repo Rate trend
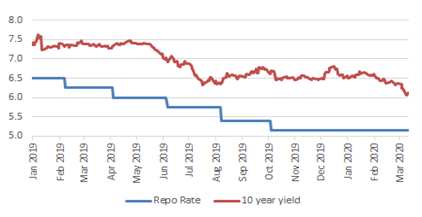
Source: Bloomberg
5. India’s forex reserves are at an all-time high of ~$480 billion, and provides buffer / stability
India Forex Reserves Trend ($ in billion)
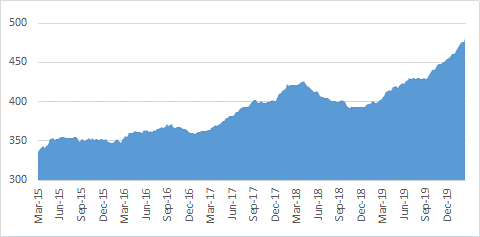
Source: Bloomberg
• India’s forex reserves are at an all-time high of ~$480 billion and provides buffer / stability.
• Import coverage ratio (no. of months of imports that forex reserves can cover) stands presently at around 12 months, which is quite healthy. During the Fed taper tantrum of 2013 import coverage ratio had dropped to around 6-7 months.
Market Outlook:
We may not be out of the woods completely and may see further short-term market volatility as new coronavirus cases continue to increase globally. Recent data shows that new cases ex-China are escalating, while new cases in China have seen a sharp slowdown. There could also be some risk to global growth this year, although it’s still a developing situation, and needs to be tracked.
However, the Indian market has witnessed a healthy correction, with the benchmark Nifty 50 index falling by around 15% from the Jan 2020 top (as on 11 March 2020). Broader markets (small/mid-caps) have also fallen in this correction, and the Nifty midcap 50 index and Nifty Smallcap 100 index is down ~28% and ~46% respectively (as of 11 March 2020) from the top seen in Jan 2018. Therefore, market valuations have turned quite reasonable, as being pointed out by various indicators. We feel this may offer some buying opportunity and investors can start to deploy partial money in equities (especially if you are underweight equities as per your risk profile).
• Market timing, as we know, is difficult; and it’s difficult to catch the bottom and top of markets accurately. However, the prudent thing is to atleast get started, or not to panic and sell-off. Historical data has shown that investments made in challenging/volatile times, has generally been quite rewarding for investors over the medium to long term.
Disclaimer: The note is not intended to be construed as any advisory from Bajaj Allianz Life Insurance Co. Ltd. for any investment or any other purpose. Any reliance of the same by the individual for any purpose, is on the sole independent understanding and requirement of the individual. The Public is advised to consult their advisor with regards to their investment.

Enter your email address to subscribe to this blog and receive notifications of new posts by email.

Facebook
Twitter
pintrest
instagram
Whatsapp
Linkedin
More