
Five strategies to deal with market volatility
#
29th Aug, 2019
- 6074 Views
NDNC disclaimer: By submitting your contact details or responding to Bajaj Allianz Life Insurance Company Limited., with an SMS or Missed Call, you authorise Bajaj Allianz Life Insurance Company Limited and/or its authorized Service Providers to verify the above information and/or contact you to assist you with the purchase and/or servicing
The Indian markets have seen some volatility and correction lately. Although the correction in the headline Nifty 50 index has been moderate, the broader markets (mid/small-cap stocks & indices) have witnessed a much deeper correction, from their highs–touched in the beginning of 2018. Here we look at some strategies that ULIP investors can use in dealing with market volatility.
1. ULIP’s have various fund options that allow you to plan your asset allocation in a tax-efficient manner
One misperception about ULIPs among some segments is that they are equity-only products. Actually, there are different asset class fund options within ULIPs like large-cap equity, mid-cap equity, asset allocation fund (mix of debt and equity), bond/debt fund, liquid fund etc. In challenging markets or during market downturns, some risk-averse investors may get concerned and may stop paying their premium or surrender their policy, and consider safer investment avenues like fixed deposits etc. However, this is not prudent, and they should be aware that there are various lower-risk fixed income fund options in ULIPs like bond fund and liquid fund, where concerned investors can consider a partial switch of money (to protect their downside risk)—rather than surrendering their policy.
The other big advantage of ULIPs compared to other competing investment products is that any fund switches are not subject to any capital gains tax implication. To give an example: in mutual funds, if you are switching from a debt fund to an equity fund, the short-term capital gains tax (upto 3 years) is taxed at the marginal tax rate (highest tax bracket is 30% plus cess and surcharge); and the long-term capital gains tax (more than 3 years) is 20% (with indexation), plus cess and surcharge (if applicable). In ULIPs there is no tax implication for any fund switches, and new-age ULIPs allow you to do multiple switches without any transaction costs. Therefore, it allows an investor to plan their asset allocation in a more tax-efficient manner.
2. Importance of asset allocation in managing your portfolio
Different asset classes provide varying returns over different time periods/years. The below table highlights the historical calendar year returns of various asset classes (colour-coded)–ranked in descending order of returns, each year. As, can be seen in the table, there is a wide dispersion in colours over the years—indicating that returns of different asset classes vary over time.
For example: Mid-cap equity and large-cap equity was the top performing asset class in CY 2007, but then became the bottom performing asset class (falling sharply) during the market downturn of 2008. Similarly, equities did well in 2012, 2014 and 2017, but was the bottom performing asset class in 2011, 2016, and 2018. Gold as an asset class outperformed during the financial crisis (in the years of 2008 to 2011), but was among the bottom performing asset class from 2013-2015. Debt outperformed in 2015 and 2016, but was an underperformer in 2017 and to some extent in 2018 as well, as bond yields hardened during these years.
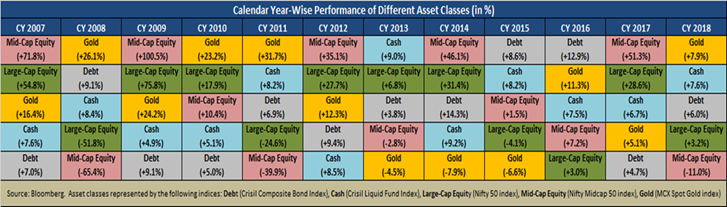 CY returns are absolute. Past performance may not be an indicator of future performance
However, a look at trailing returns (in the table below) shows that even though equities comes with intermittent corrections/volatility, it is among the top performing asset classes over the long term, and helped in wealth creation for investors.
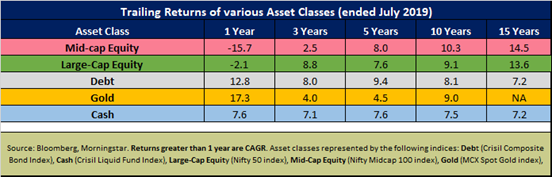 Past performance may not be an indicator of future performance
It would be prudent to have a mix of different asset classes in your portfolio. Asset allocation should be reviewed from time to time, and particularly becomes of importance during periods of market volatility. Investors can choose their asset allocation mix based on their risk appetite and investment horizon. We also recommend that investors can use a goal-based approach to asset allocation. Suppose one has a 10-year investment goal; since the investment horizon is longer—the investor can start off with higher allocation to equities and gradually start reducing equity allocation and switching to debt/liquid fund, as they approach the maturity term of their policy. This will help to protect the wealth created from investing in equities over the long term (in case of a market downturn) before maturity of the policy—and help the investor in meeting their investment goal. Novice investors, who find it difficult to choose their asset allocation mix can also consider our Asset Allocation Fund in volatile times, where the debt-equity mix changes, depending on the market conditions and the fund’s manager’s market outlook. Besides this, there are four portfolio investment strategies, in our ULIP products, which can help investors to plan their asset allocation.
3. Invest systematically, as market timing is difficult. Patience is the key in creating wealth.
ULIPs allow you to invest systematically in markets (you can choose premium payment mode over various frequencies). Investing systematically in equities helps in rupee-cost averaging i.e. averages out the cost of your investments, and hence lessens the results of short-term market fluctuation on your investments. In-fact in a falling market SIP (systematic investment plan) will help in acquiring more units for the investor. Overall, SIP helps in taking out the guess-work in investing, as market timing can be difficult—even for a seasoned/professional investor. However, the key-word here is ‘patience’, which is required in creating wealth. Let’s explain this with the help of a real illustration (refer to the chart below). Let us suppose that the investor started investing at the peak of the previous market cycle (in Dec 2007), and invests Rs. 50,000 ever year in Bajaj Allianz Life Growth Fund (a large-cap equity fund). In CY2008, the global financial crisis happened, and the fund’s NAV fell by ~50%, while the benchmark Nifty 50 index fell by 52% during the year. If the investor would have got spooked by the market volatility/correction and exited, he/she would have done so at a significant loss. However, if the investor would have continued with the SIP (and not got deterred by volatility / market corrections) then the cumulative investment of Rs. 6 lakhs over the years, would be worth (as of July 2019):
This indicates that patience is key in equity investing, and helps in long term wealth creation.
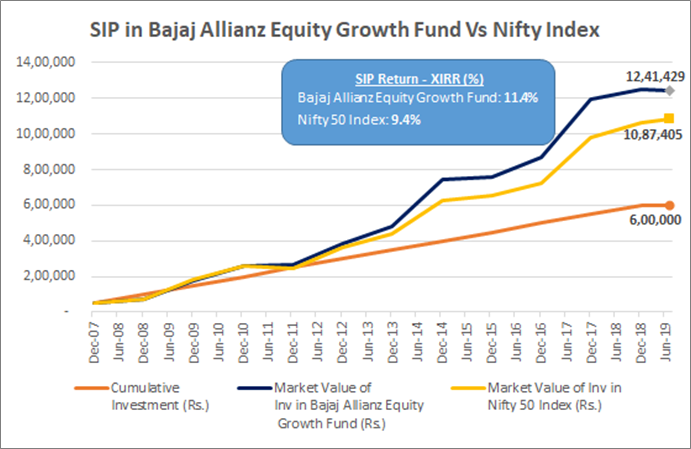 Source: Bloomberg, Bajaj Allianz Life Insurance Analysis. Data as of 31 July 2019. Past performance may not be indicator of future returns.
4. Longer the investment horizon—lower the chances of making negative returns in equities
Famed investor Warren Buffet had once said—“The stock market is a device for transferring money from the impatient to the patient”. Therefore, by investing for the short term, the investor can experience intermittent market volatility/losses. However, the long term (patient) investor is rewarded, and data shows that chances of making negative returns in equities, for a longer holding period (above 5 years), significantly reduces.
As shown in the table below, we have displayed the historical returns for Nifty 50 index over the past 28 fiscal years, for various holding periods (1 yr, 3 yrs, 5 yrs, 10 yrs etc.), and the percentage of times in each holding period when the returns have been positive. As can be seen, for a shorter-term holding period (like 1 year), the returns were positive in only ~60% of the observations/cases. Also range of returns is quite wide, as shown by the difference in the maximum and minimum return for 1 year holding period—indicating higher volatility in returns. However, over a 5 year holding period, 88% of the observations were positive return years, and the range of returns (between maximum to minimum) also reduces—indicating lesser volatility and more stable returns. For above 10 year period, there have been no cases/observations of negative returns—as indicated by historical data.
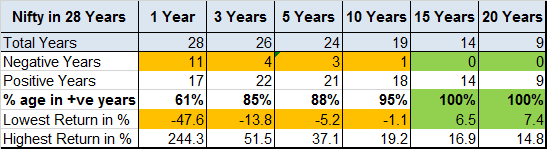 Source: Bloomberg, Bajaj Allianz Life Insurance Analysis. Past performance may not be indicative of future returns. Returns greater than 1 year are CAGR.
5. Stay invested & keep perspective— market downturns are normal and short-lived
Source: Bloomberg, Bajaj Allianz Life Insurance Analysis. Past performance may not be indicative of future returns. Returns greater than 1 year are CAGR.
5. Stay invested & keep perspective— market downturns are normal and short-lived
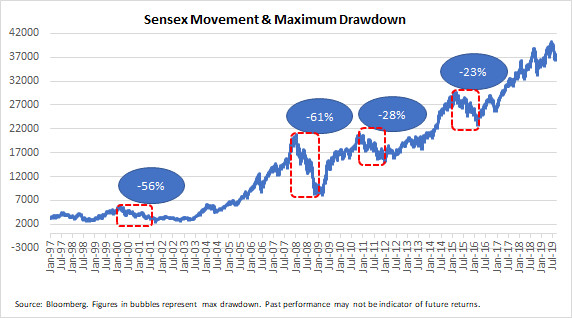
Markets downturns are normal and cyclical in nature. The chart below shows the journey of the Sensex index since 1997. As can be seen in the chart, the Sensex has risen several fold over the years—thereby indicating that it has created tremendous wealth for investors. However, at the same time there have been intermittent corrections /volatility from time to time. Maximum drawdown means the maximum loss (in % terms) from the top of the index to bottom of the index (where the market recovery starts). The Sensex has seen a maximum drawdown of 56% during the dotcom bubble crash of 2000, a max drawdown of 61% during the global financial crisis of 2008-09, and reasonably large drawdowns in 2013 and 2015 as well. At the same time, it can be observed that these market downturns do not last for too long, and are generally short lived.
Therefore, investors should keep perspective, stay invested, and not get too much carried away by short term market volatility. Its worthwhile noting the famous quote from Warren Buffett–“Be fearful when others are greedy, and greedy when others are fearful”.

Enter your email address to subscribe to this blog and receive notifications of new posts by email.
Facebook
Twitter
pintrest
instagram
Whatsapp
Linkedin
More